In today’s information age, we’re drowning in data. Numbers, statistics, charts – it’s enough to make anyone’s head spin. But what if we could transform this dry information into something engaging, even beautiful? Enter data visualization: the art of using visual elements to communicate data in a clear, compelling, and memorable way.
Why Data Visualization Matters
Data visualization isn’t just about making things pretty. Here’s why it’s crucial:
- Understanding Through Seeing: Humans are visual creatures. We process visuals faster and retain information better when it’s presented in a graphical format.
- Breaking Down Complexity: Data visualization can simplify complex datasets, making them easier to understand and interpret for audiences of all levels.
- Identifying Trends and Patterns: Charts and graphs can reveal hidden trends and patterns that might go unnoticed in raw data, leading to valuable insights.
- Engaging Storytelling: Data visualization allows you to tell a story with your information, making it more engaging and impactful.
The Tools of the Trade:
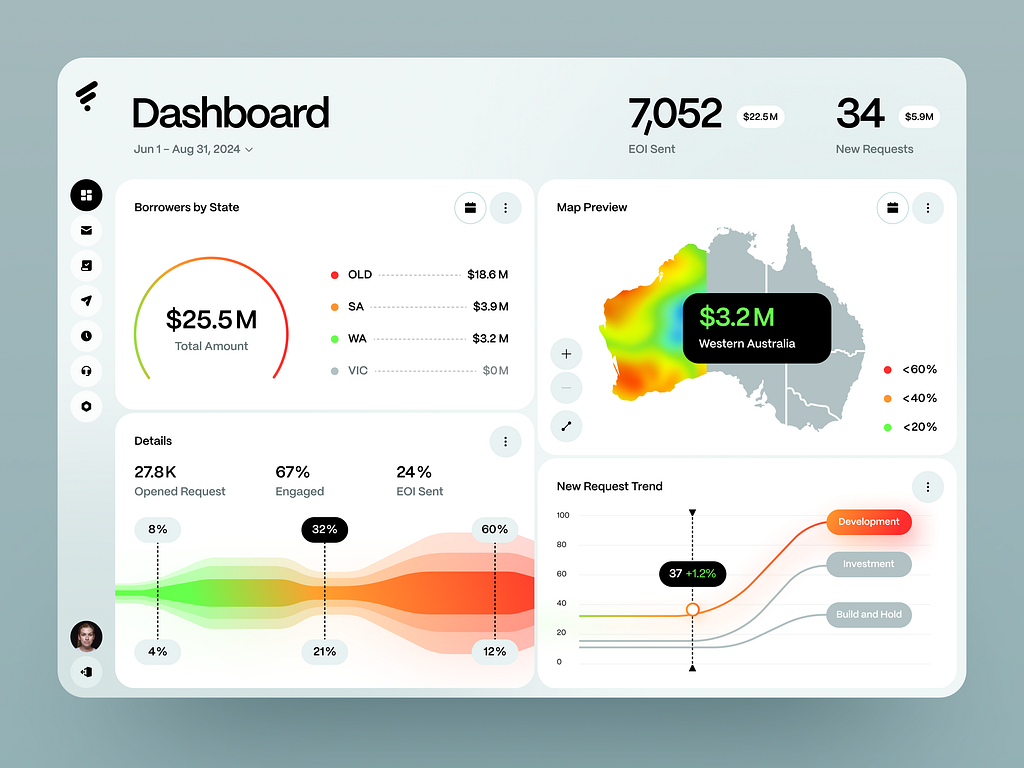
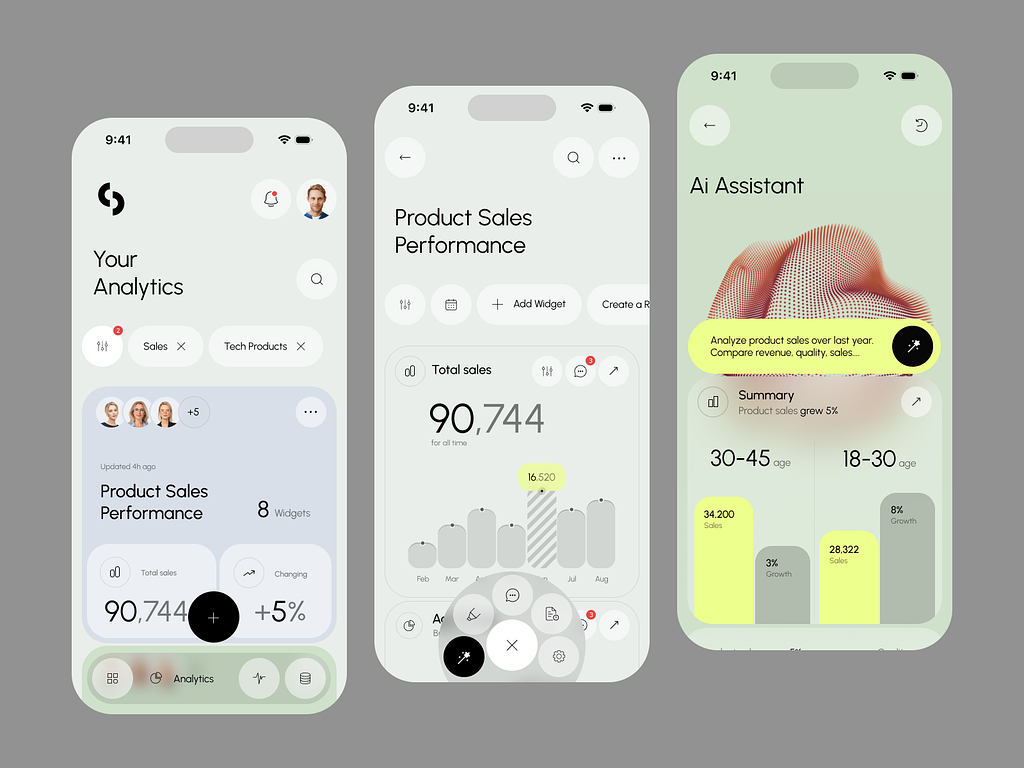
The data visualization toolbox is brimming with options, from the classic bar chart to the innovative interactive infographic. Here are some popular choices:
- Bar Charts: Simple and versatile, bar charts are ideal for comparing categories or showing trends over time.
- Line Charts: Perfect for illustrating trends and changes in data over time.
- Pie Charts: Best used for showing proportions of a whole, but avoid using too many slices.
- Scatter Plots: Reveal relationships between two variables, often used to identify correlations.
- Heatmaps: Use color intensity to represent data values, ideal for visualizing large datasets.
- Infographics: Combine various visual elements like charts, graphs, and illustrations to tell a comprehensive data story.
Beyond the Chart:
Effective data visualization goes beyond just choosing the right chart type. Here are some key principles to keep in mind:
- Clarity is King: Keep your visuals simple and uncluttered. Let the data be the star of the show.
- Color with Care: Use color strategically to highlight key information and create visual hierarchy.
- Label Everything: Ensure all axes, data points, and visuals are clearly labeled for easy understanding.
- Tell a Story: Use data visualization to guide viewers through a narrative, highlighting key insights and takeaways.
Data Visualization for Everyone
Data visualization isn’t just for data scientists or graphic designers anymore. With user-friendly tools and online platforms, anyone can create compelling data visualizations. Whether you’re a marketer presenting research findings, a social media manager showcasing audience demographics, or a student explaining a complex scientific concept, data visualization can be your powerful ally.
The Future of Data Visualization
Data visualization is constantly evolving. Interactive elements, animation, and virtual reality are pushing the boundaries of how we interact with data. As technology advances, data visualization will become even more sophisticated and accessible, allowing us to unlock the true power of information and turn it into beautiful, meaningful stories.
So, the next time you’re faced with a mountain of data, don’t despair! With the power of data visualization, you can transform it into something truly impactful, leaving a lasting impression on your audience.